
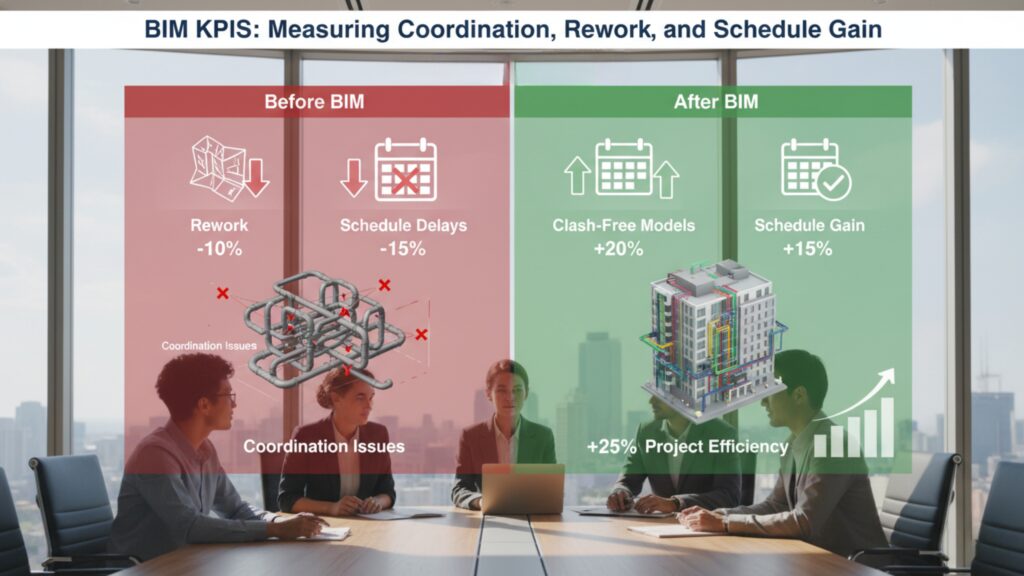
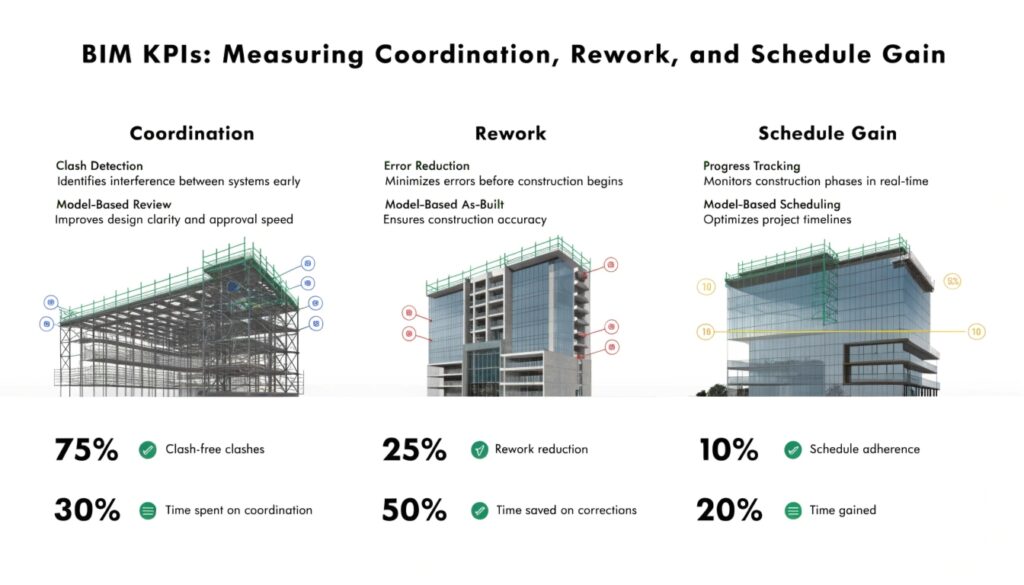
Dashboards are everywhere—useful metrics, not so much. If your coordination meetings still feel like Groundhog Day, you don’t need more charts; you need the right ones. Below are the ten BIM Key Performance Indicators (KPIs) we use to track what truly matters: BIM coordination quality, rework prevention, and schedule gain. Each KPI includes what it tells you, how to calculate it, where the data lives, and practical targets. Use these as a starter kit and tune them for your project typology.
1) Clash Closure Rate
What it tells you: How effectively the team turns clashes into decisions between coordination cycles.
Formula:
Clash Closure Rate = (Clashes Closed This Cycle ÷ Clashes Open at Start of Cycle) × 100
Data source: Coordination model (federation), issue tracker.
Target: 70–85% per cycle on stable scopes; lower early in design, higher as you approach fabrication.
Gotchas: Don’t game the number by downgrading severities. Tag each clash with a trade, location, and due date to keep owners accountable.
2) First-Pass Coordination Approval (FPCA)
What it tells you: Percentage of views/areas that pass coordination without bounce-backs.
Formula:
FPCA = (Areas/Views Approved on First Review ÷ Total Areas/Views Submitted) × 100
Data source: Submittal logs, model review logs.
Target: 60–75% in mid-phase; 80–90% as you near CD/LOD 350 sign-off.
Gotchas: Define “approval” up front (e.g., no Tier-1 clashes, Tier-2 mitigated). This KPI sharply predicts rework risk.
3) Model Rework Rate
What it tells you: How much time the team spends fixing past decisions vs. creating new value.
Formula (time-based):
Model Rework Rate = (Rework Hours Logged ÷ Total Modeling Hours) × 100
Data source: Timesheets, issue tags (“rework”), model history.
Target: Under 15% after DD stabilization; <10% in late coordination.
Gotchas: Separate client-directed scope changes from preventable rework (coordination misses, naming errors, sloppy families).
4) Field Rework Rate (BIM-Attributable)
What it tells you: Whether digital coordination is actually reducing physical do-overs.
Formula (cost-based):
Field Rework Rate = BIM-Related Rework Cost ÷ Total Installed Cost
Data source: Cost reports, punch lists, NCRs tied to model/shops.
Target: Trend down to <2–3% on coordinated trades.
Gotchas: Require a root-cause tag (e.g., “coordination miss,” “late design change,” “fabrication variance”) so you can act, not argue.
5) RFI Rate & Turnaround (BIM-Scope)
What it tells you: Whether information in the model and shops is clear enough to keep work moving.
Formulas:
RFI Rate = (# RFIs on BIM Scope ÷ Total BIM-Scope Sheets/Views) × 100
RFI Turnaround = Avg. Days from Submit to Answer
Data source: RFI log, shop submittals, model comments.
Target: Drive rate down over time; turnaround <7 calendar days on critical path items.
Gotchas: Classify RFIs by cause (missing dimension, unclear elevation, conflicting note). Patterns will point to training or template fixes.
6) Schedule Gain from BIM
What it tells you: The real, time-based value of coordination and prefabrication.
Formula:
Schedule Gain (days) = Baseline Duration – Actual Duration (for BIM-influenced activities)
Data source: 4D look-aheads, baseline vs. current schedule, install logs.
Target: 5–10% compression is common on heavily coordinated corridors and racks; more is common with prefab.
Gotchas: Don’t credit BIM for non-BIM wins. Tie the gain to specific model-led actions (e.g., multi-trade racks and early sleeve packages).
7) Prefabrication Percentage (Model-Driven)
What it tells you: How much of the scope converts to predictable, off-site work?
Formula (qty-based):
Prefab % = (Prefabricated Quantity ÷ Total Quantity) × 100
(Use linear feet, spool count, or assemblies.)
Data source: Spool logs, BOMs, receiving logs.
Target: Varies by trade—20–50% for piping/duct in repeatable zones is a solid outcome.
Gotcha: Count installed prefabs, not just “released.” This KPI correlates strongly with schedule gain.
8) Installation Productivity vs Plan
What it tells you: Whether coordinated shops/spools are actually easier to install.
Formula:
Productivity Index = Actual Install Rate ÷ Planned Install Rate
(e.g., LF/day, spools/day)
Data source: Daily reports, look-aheads, and earned value.
Target: ≥1.0. A sustained value >1.1 indicates your model-to-field pipeline is working.
Gotchas: Normalize for crew size and weather. Use this KPI to tune spool sizing and kitting.
9) As-Built Variance (Dimensional)
What it tells you: How closely the installed work matches the coordinated model.
Formula:
As-Built Variance = Avg./Max Deviation (in) between Scan and Model for Critical Elements
Data source: Laser scans, total station points, and as-built surveys.
Target: Keep average under 1/2″ for MEP mains (project dependent). Track by zone to catch drift early.
Gotchas: Establish tolerances by system. Gravity systems deserve tighter control around slopes and inverts.
10) Information Completeness (Parameters/LOD)
What it tells you: If the model is data-rich enough to drive takeoffs, shops, and FM.
Formula:
Parameter Completeness = (Filled Required Parameters ÷ Required Parameters) × 100
(Track by category: doors, valves, equipment, etc.)
Data source: Model checker, parameter audits.
Target: 95–100% at each exchange milestone.
Gotchas: A pretty 3D with empty fields won’t feed BOMs or CAFM. Lock a data dictionary early.
How to Operationalize These KPIs (Without Drowning in Admin)
- Define ownership. Assign each KPI to a role (e.g., BIM Coordinator, Trade Lead, Project Controls). If no one owns it, it will decay.
- Standardize definitions. Publish a one-page KPI dictionary: purpose, formula, data source, cadence, and thresholds (green/yellow/red).
- Automate the pull. Wire your BIM modeling services stack (CDE, issue tracker, and authoring tools) so numbers refresh with minimal manual effort.
- Make it visible. Post weekly snapshots: a single page per discipline with trend lines and three actions per KPI.
- Close the loop. Every metric should trigger a behavior—an additional clash session, template fix, or sequencing change. No “FYI” metrics.
Targets by Project Phase (Rule of Thumb)
- Early Design (SD/DD): Higher clashes are normal; focus on clash closure rate and FPCA.
- Late Coordination (LOD 350): Push Model Rework Rate and RFI Rate down; raise Information Completeness.
- Fabrication/Install: Track Prefab %, Productivity Index, Schedule Gain, and As-Built Variance.
Common Pitfalls (and Simple Fixes)
- Vanity dashboards. If a KPI doesn’t change a meeting agenda or a field task, drop it.
- Mixed definitions. “Closed” must mean the same thing to all trades; publish criteria.
- Stale data. Automate ingestion from your coordination platform and scheduling tools; review weekly.
- Blame games. Tag issues by root cause, not just trade. Fix the process that created the issue.

Why This Matters
When you measure the right things, BIM coordination stops being a ritual and starts being a lever. You’ll see fewer RFIs, cleaner inspections, more prefabrication, and tangible schedule gain. Just as important, your team spends less time relitigating the past and more time installing work that sticks. If you want a running start, bring in experienced BIM modeling services to set up your KPI dictionary, automate data flows, and coach teams through the first two cycles. After that, your dashboard won’t just look good—it’ll pay for itself in fewer change orders and faster, safer installs.
Frequently Asked Questions (FAQs)
1. What are BIM KPIs?
BIM KPIs (Key Performance Indicators) are measurable metrics used to evaluate the effectiveness of BIM coordination, modeling accuracy, collaboration, productivity, and project performance throughout design, fabrication, and construction.
2. Why are BIM KPIs important in construction projects?
BIM KPIs help project teams identify coordination issues early, reduce rework, improve installation efficiency, minimize RFIs, and achieve measurable schedule and cost savings.
3. Which BIM KPI is most important?
There is no single “best” KPI. However, Clash Closure Rate, Model Rework Rate, and Schedule Gain from BIM are often considered the most impactful because they directly affect coordination quality, project timelines, and construction costs.
4. How often should BIM KPIs be reviewed?
Most BIM teams review KPIs weekly during coordination meetings. Critical projects may require daily monitoring for clashes, RFIs, and installation productivity.
5. What is a good Clash Closure Rate in BIM coordination?
A healthy clash closure rate is typically between 70% and 85% per coordination cycle on stable project scopes. Early design phases may have lower rates.
6. How does BIM reduce field rework?
BIM improves clash detection, coordination, constructability reviews, and prefabrication planning, which helps prevent installation conflicts before work reaches the field
7. What tools are commonly used to track BIM KPIs?
Common tools include:
- Autodesk Navisworks
- Autodesk Revit
- BIM 360
- Autodesk Construction Cloud
- Power BI
- Procore
These platforms help automate issue tracking, reporting, model audits, and dashboard creation.
8. What is FPCA in BIM?
FPCA stands for First-Pass Coordination Approval. It measures how many model areas or views are approved during the first review without requiring revisions or re-coordination.
9. What causes high BIM rework rates?
Common causes include:
- Poor coordination between trades
- Inconsistent modeling standards
- Incorrect family usage
- Late design changes
- Missing parameter information
- Unclear ownership of clashes
10. What is BIM-attributable field rework?
It refers to physical rework in construction caused by issues that should have been identified or prevented through BIM coordination and model review processes.
11. How does prefabrication improve BIM project performance?
Model-driven prefabrication improves installation speed, reduces waste, enhances quality control, and shortens project schedules by moving work from the site to controlled factory environments.
12. What is Information Completeness in BIM?
Information Completeness measures whether required model parameters, metadata, and LOD requirements are properly filled and ready for takeoffs, fabrication, facility management, or asset handover.
13. Can BIM KPIs improve project schedules?
Yes. Effective BIM coordination often leads to fewer clashes, faster approvals, reduced RFIs, smoother installations, and measurable schedule compression.
14. What is a BIM dashboard?
A BIM dashboard is a visual reporting system that tracks coordination metrics, project performance, clashes, RFIs, model health, schedule trends, and construction productivity in real time.
15. Who is responsible for tracking BIM KPIs?
Depending on project structure, BIM KPIs are usually tracked by the following:
- BIM Managers
- BIM Coordinators
- VDC Teams
- Project Controls Teams
- Trade Coordination Leads